Extrapolate Survey Tool
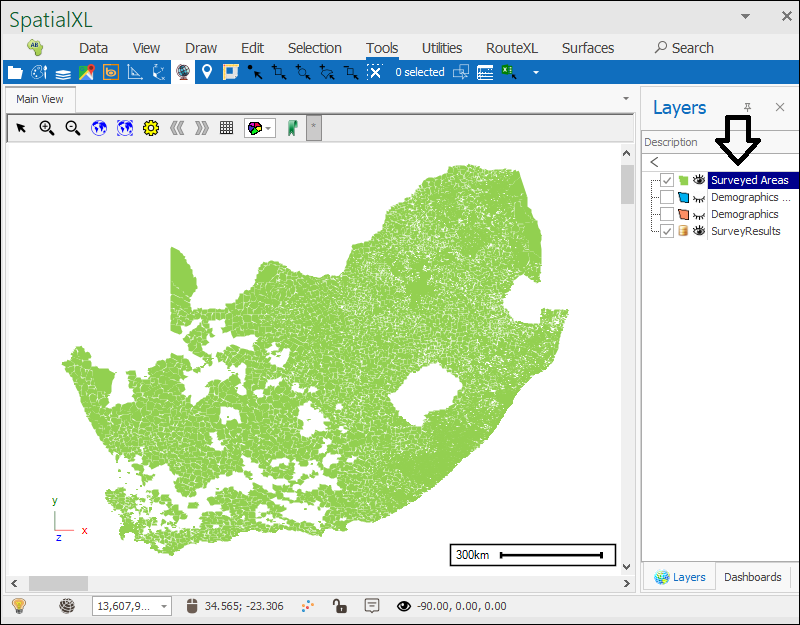
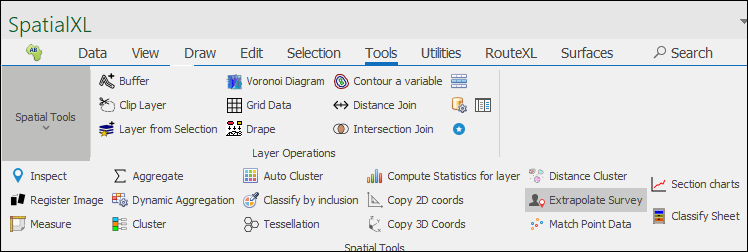
❖The Extrapolate Survey tool is a tool in all our spatial products that allows you to broaden a set of survey results already gotten into a wider area based on certain criteria; it can be found here:
❖Before using this tool, you will need to have some things set up.
Firstly, you will need a spreadsheet of your survey results:
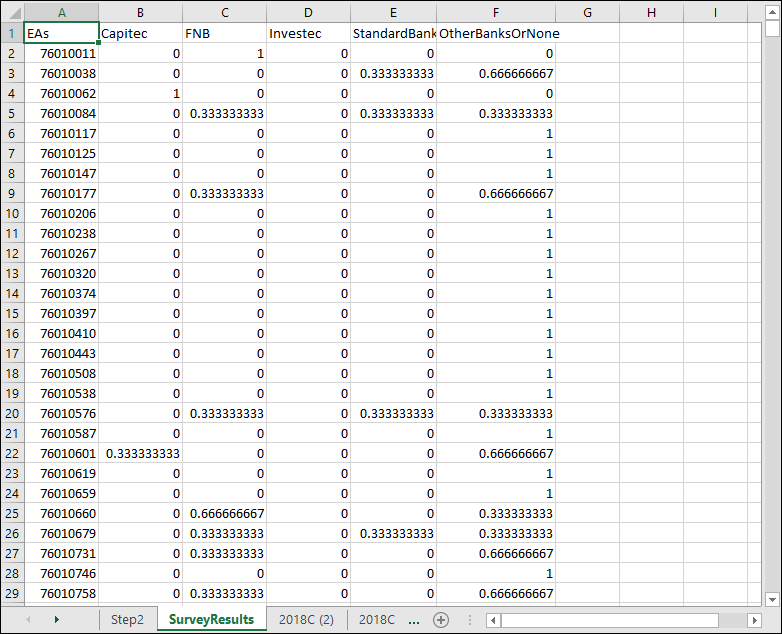
In my survey data there is data about percentage of people who use a particular bank in a particular enumeration area (EA).
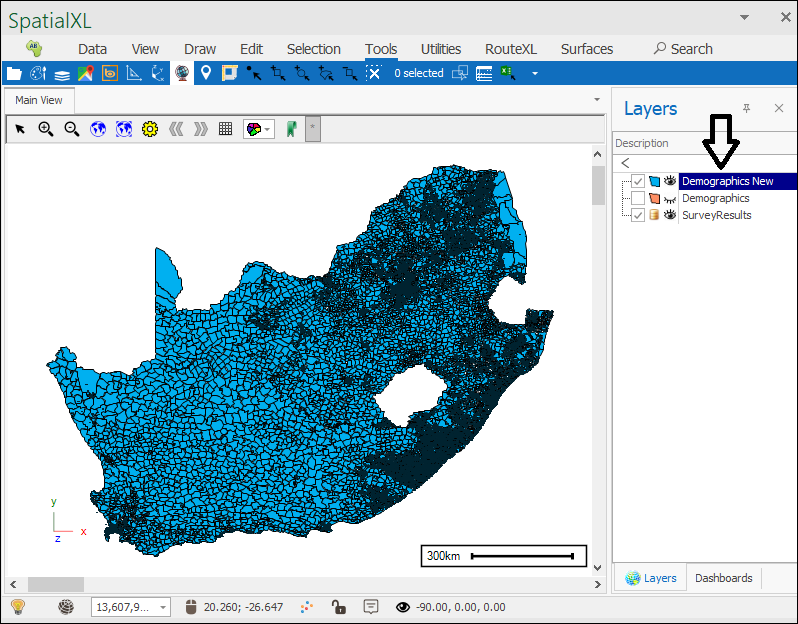
❖In order to use this data in the tool it will need to be added as a layer in the spatial pane:
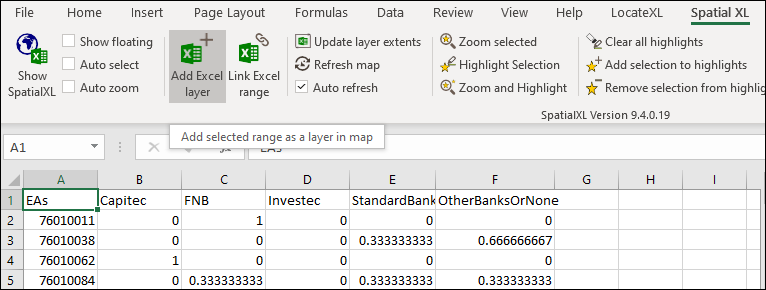
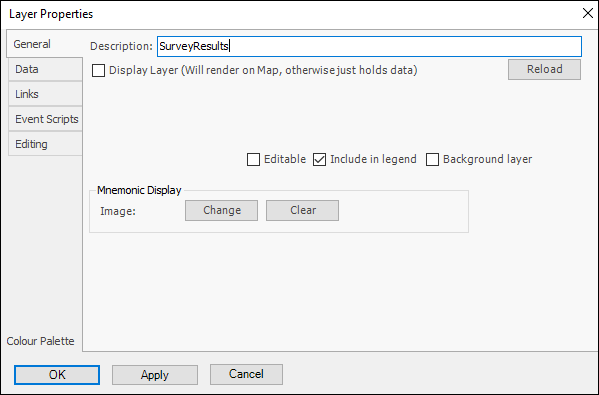
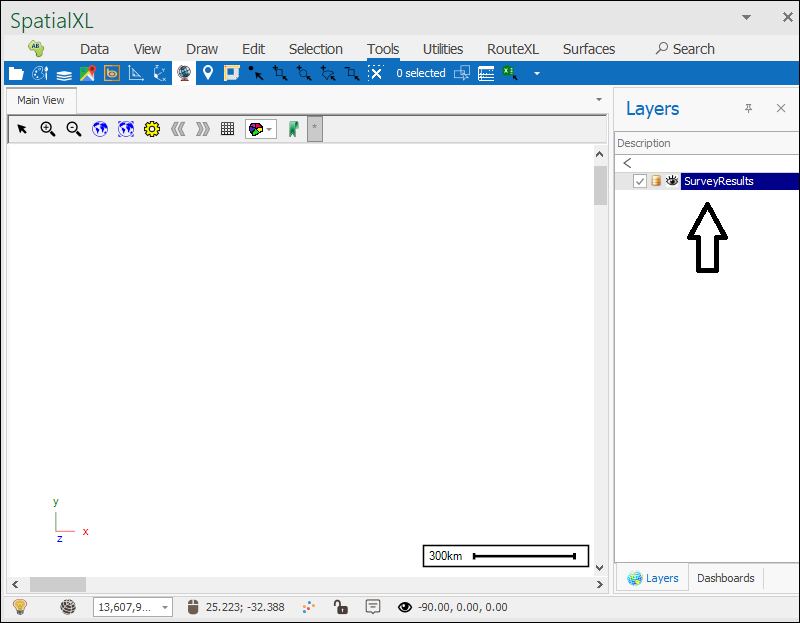
If you have no coordinate data for the areas in your survey results then it is just added as a data layer, meaning it does not display on the scene but just holds data(which is the case in this example).
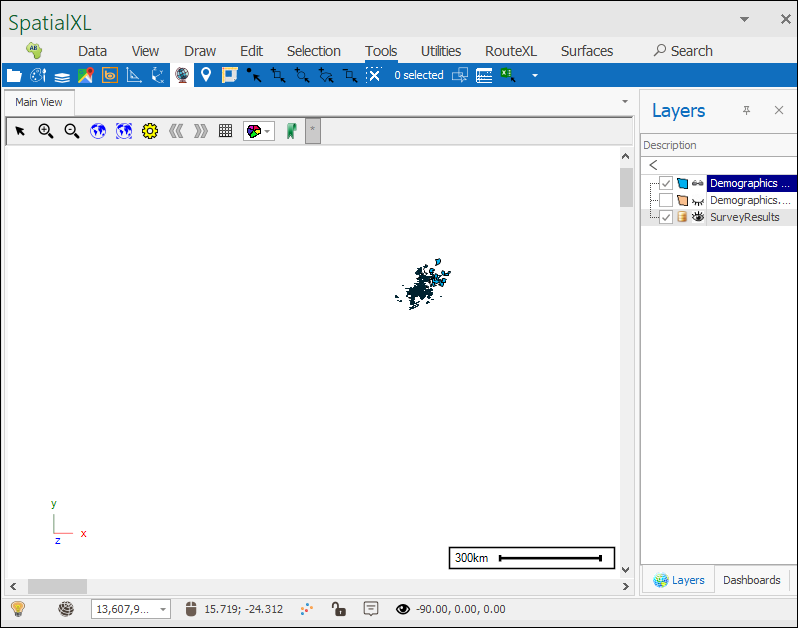
❖The next thing you would have is a set of data with the same areas as those in your survey results and more, plus some extra information for those areas that your survey results don’t have such as Dominant Race in that area or Dominant Income. For this I have a Demographics layer which actually exits as a SpatialVU file and I will bring it in: (if this data existed as a spreadsheet you would go through the same steps above to add as it as a layer):

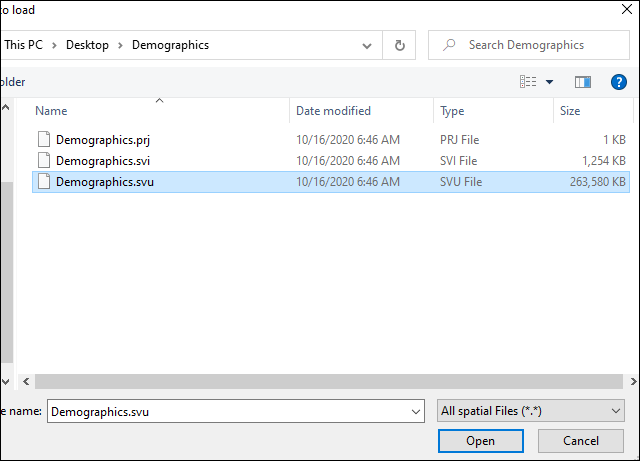
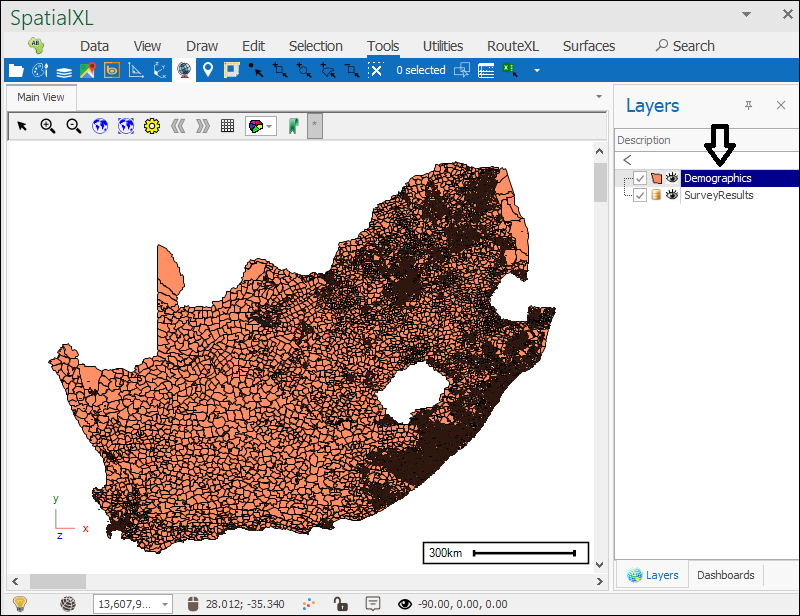
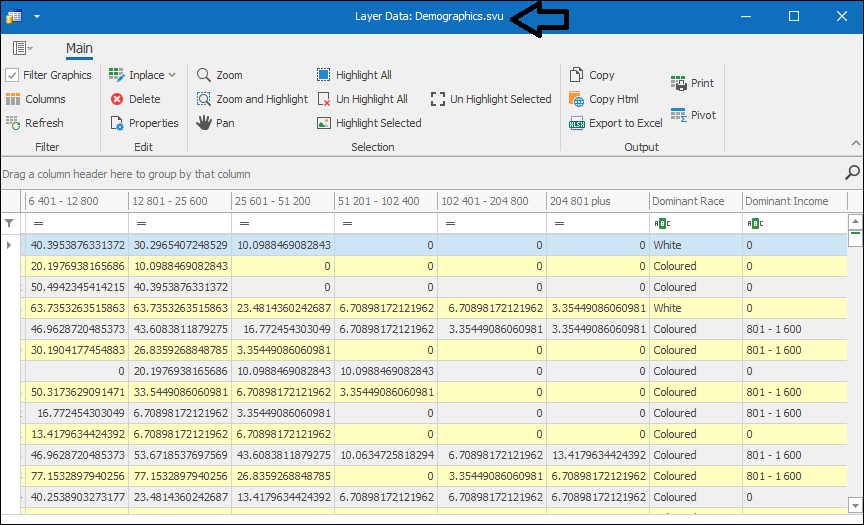
This demographics data does have coordinate data as well, so it is displayed on the scene.
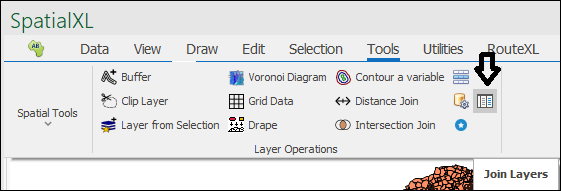
❖Now the next thing you would want to do is a join of these two sets of data to have all this data nicely linked up and in one place. To do this you use the Join Layers tool. (to see how to use this tool refer to the Join Layers Tool manual):
❖After having done the join, your data will now be linked up:
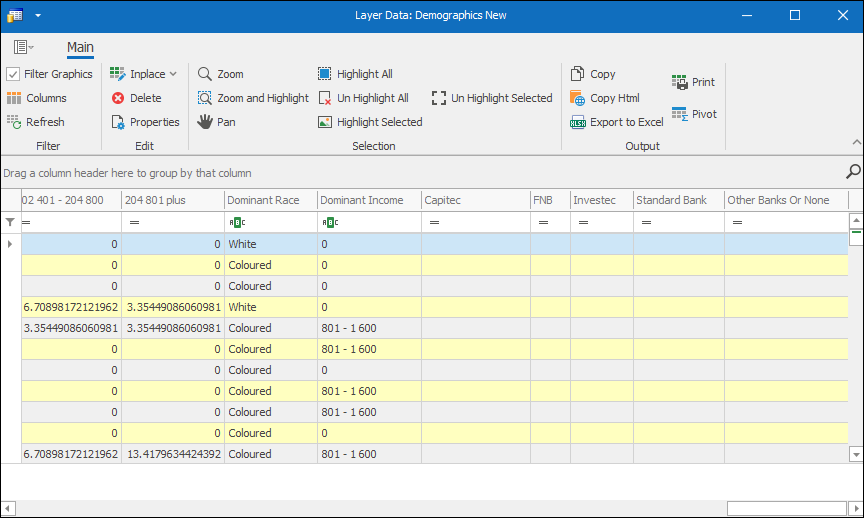
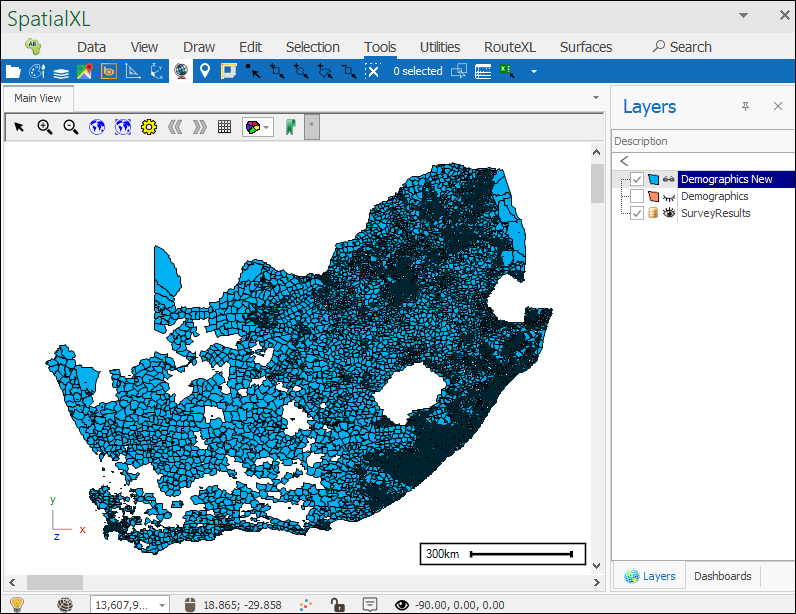
I will filter out the blanks and see how many areas were surveyed:
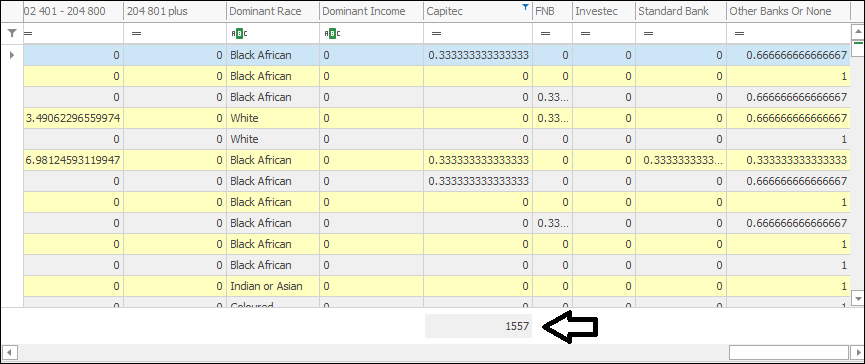
As you can see 1557 areas were surveyed.
❖Now what we would like to do is expand these survey results into more areas so let’s go ahead and open the Extrapolate Survey tool:
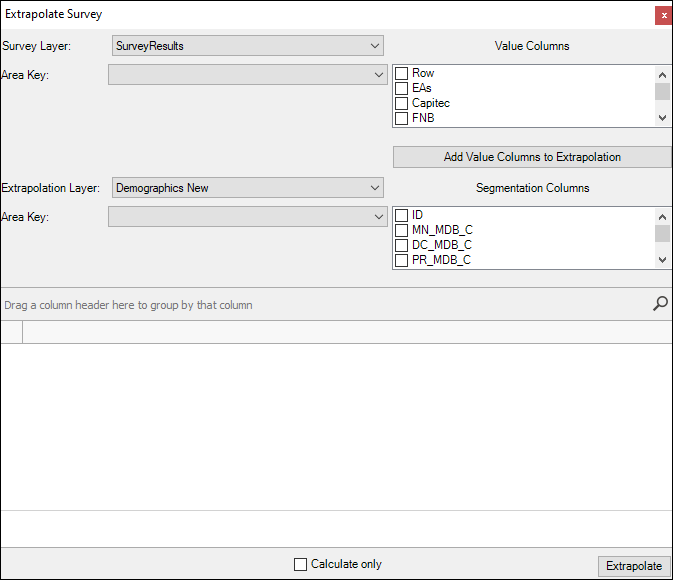
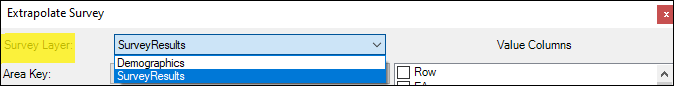
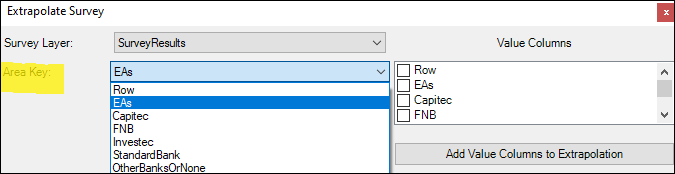
❖The first step is to choose which layer is the Survey Layer:
❖Then you need to choose your Area Key in your survey results data which is basically the unique identifier for the areas surveyed:
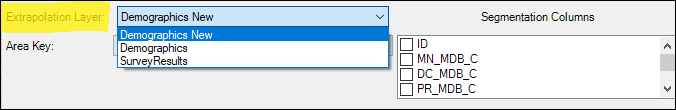
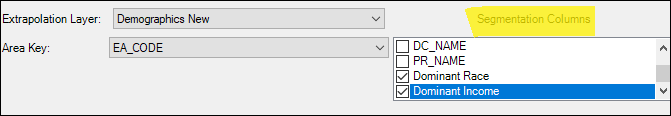
❖Next, choose which layer is the Extrapolation Layer, which is the layer that the survey results will be extrapolated to:
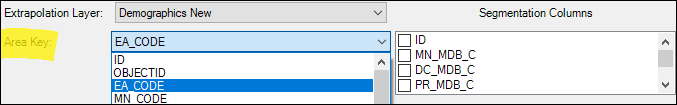
❖Then you need to choose an Area Key in this set of data as well and it will be a key shared by your survey layer:
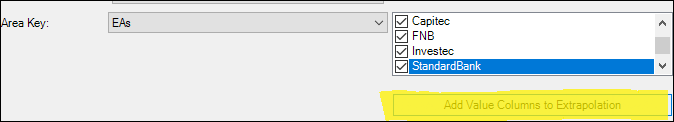
❖Next you will choose the Value Columns in your survey layer that you would like to be extrapolated to the extrapolation layer:
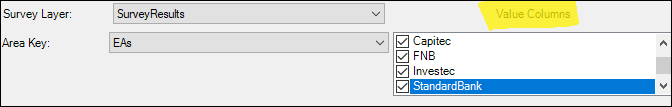
Below this is an Add Column Values to Extrapolation button which you would press if these columns didn’t also exist in the extrapolation layer, but luckily we did a join so they do exist and the extrapolated data can be populated there:
❖Next you will choose what columns in your extrapolation layer you will use to act as a signature for a particular surveyed area, meaning your surveyed areas will be segmented according to particular characteristics in the Segmentation Columns chosen and then any un-surveyed area(which is what we are trying to extrapolate into) which shares the same signature will have that survey data extrapolated into it, this is the essence of what this tool does:
❖Now what you can do before you extrapolate is have Calculate only ticked on and then click Extrapolate, the calculations done by the tool will be populated in the grid below and you can view them:
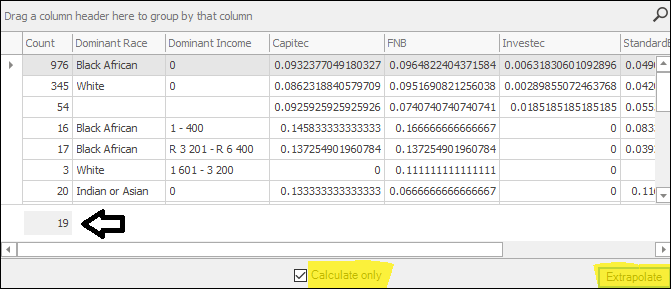
So as you can see here it created a total of 19 segments each with a unique signature, and as an example in the first row you can see there are 976 areas that have a signature of Dominant Race Black African and Dominant Income 0.
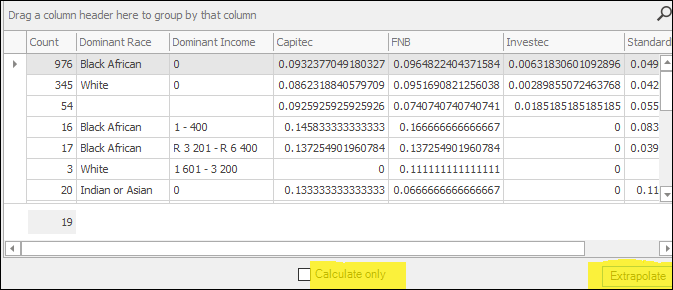
❖Once you have seen the calculations you can now untick Calculate only and click Extrapolate to do the extrapolation:
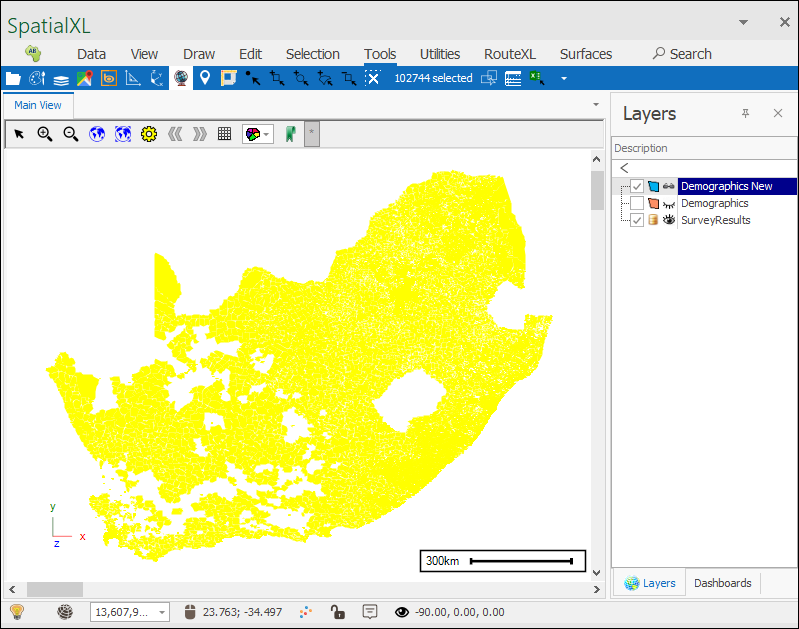
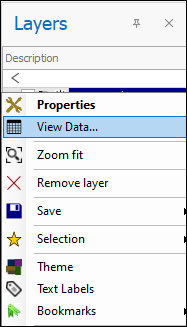
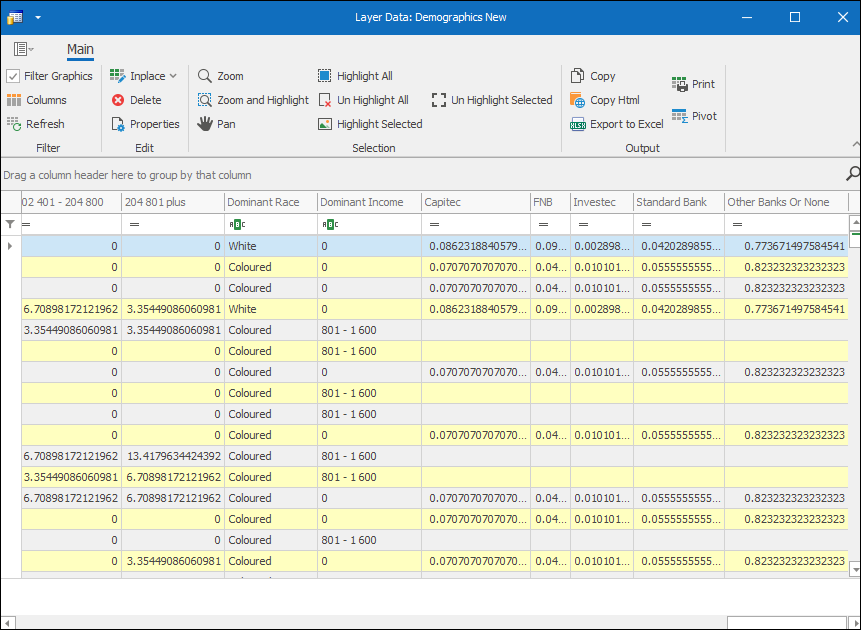
❖Your data has now been extrapolated and you can view it in the extrapolation layer by right clicking it and selecting View Data:
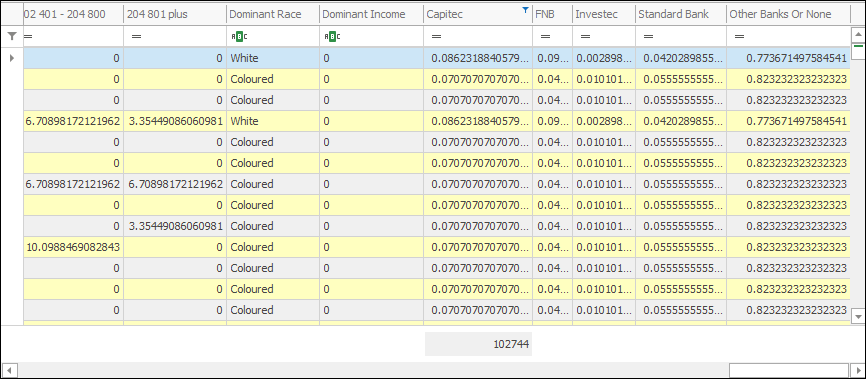
If you filter out the blanks and do a count you will see there are now 102 744 areas with survey results whereas before we only had 1557:
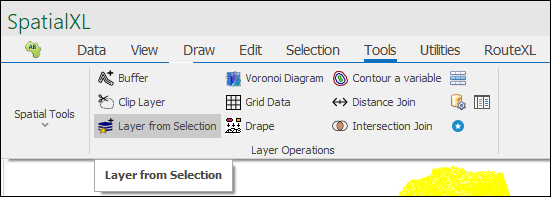
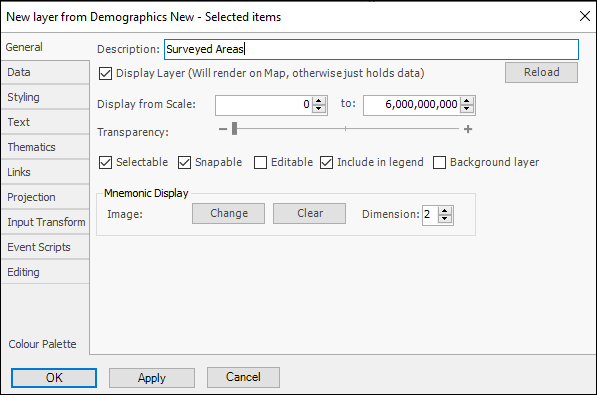
Once all the blanks are filtered out it will also be filtered in the scene and what you can then do is select these areas and create a new layer from that so that you have all surveyed areas in one layer: